Siddharth Dwivedi
If you’ve run or worked at a startup, you know what Google Analytics for. However, you cannot be expected to be a pro at it. There is so much you can do in Google Analytics. Even people with five years of experience (which I have too 😉 ) fail to use it to its full potential.
Having said that, you can still make great deductions if you just focus on some Google Analytics metrics.
In this blog post, we will discuss the 8 key Google Analytics metrics that you must keep track of.
Before going right in, I want to make a point.
You will often encounter dimensions in Google Analytics. They look like metrics. But they are not.
So to use the analytics tool better, you must know the difference.
Dimensions vs Metrics in Google Analytics
Essentially, dimensions is a description of the data. They are the labels in the rows of your reports.
Think of a dimension as describing the “what,†as in “what keyword did they use†or “what city is the visitor from†or “what pages were viewed.â€
Google Analytics Metrics, on the other hand, are the characteristics of dimensions which can be measured.
They have numerical values. Think of a metric as answering “how many†or “how long,†as in “how many visits†or “how long a visitor was on the site.â€
Google Analytics divides all the metrics into three major categories:
- Acquisition Metrics
- Behaviour Metrics
- Conversions Metrics
So let’s move on and talk about the metrics every entrepreneur should always keep watch.
Key Google Analytics Metrics
1. Users
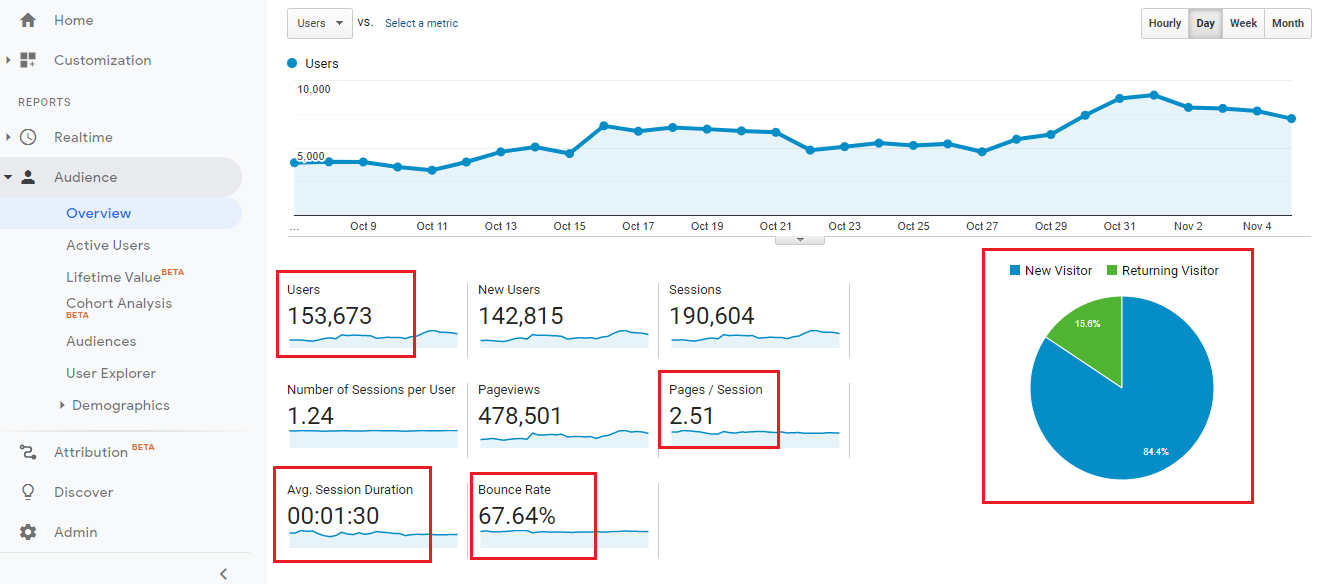
Users refers to the number of unique visitors to your website in a time range you have selected.
This metric is always visible on your Google Analytics default dashboard. However, you can access it in Audience and then clicking on Overview.
It’s probably the most tracked Google Analytics metric because it tells you clearly how many people actually came to your website. Without this base metric, other derived metrics like conversion rate won’t mean anything.
How is a User calculated in Google Analytics?
When a user lands on your website with his device, Google Analytics adds a cookie on that specific device with a client ID.
A client ID is created using a combination of a random number and a time stamp.
For example, a client ID looks like this 1987654321.34567890, where 1987654321 is the unique random number and 34567890 is the time stamp.
Once client ID is counted as one user.
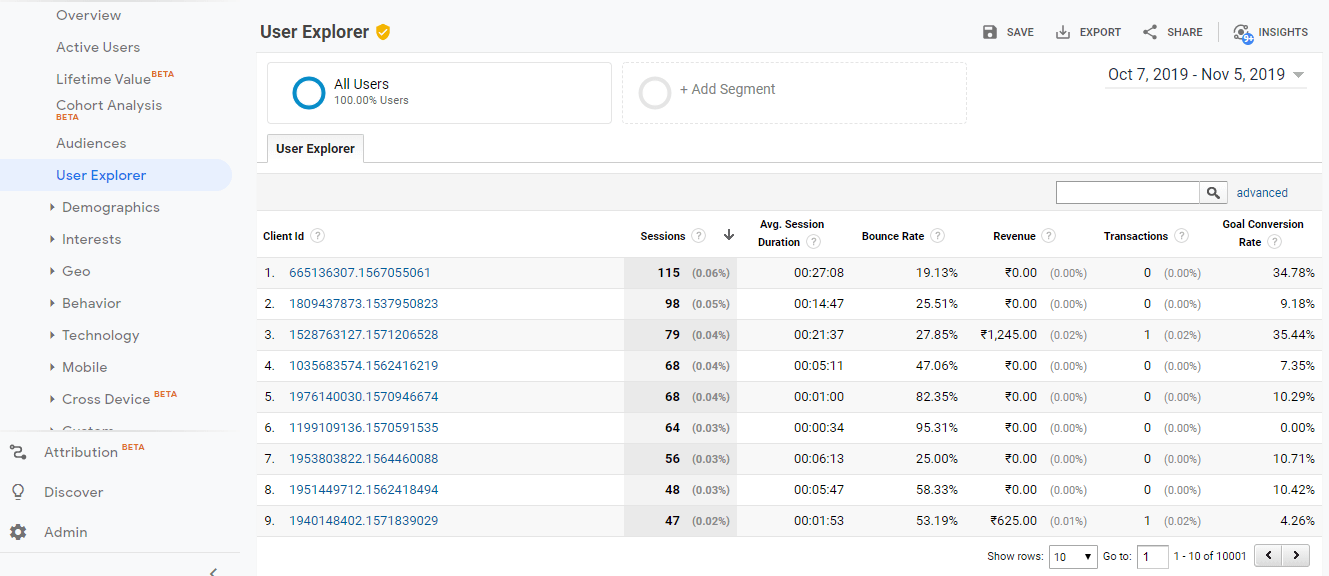
This client ID is stored in the device from which your user came on your website. So if a user came on your website from his laptop using Google Chrome but comes back again using another browser or device, it will be counted as another user.
2. Percentage of New Users
As an entrepreneur, you always want to see how many people are coming back. At the same time, you need to add more people into the top of the funnel.
That means, more and more new web visitors.
In Audiences section, you can see the percentage of new visitors and the percentage of returning visitors in a specific time duration.
If you take the definition of client ID into account, all new visitors refer to all the website hits where a new client ID is created.
Similarly, a returning visitor is someone whose client ID already existed.
3. Bounce Rate
Most blogs in the world define bounce rate and interpret bounce rate as “the percentage of people who leave after viewing only one page.“
This is in contrast to how Google Analytics define bounce rate:
“Bounce Rate refers to the single-page sessions divided by all sessions where a visitor exists the webpage without performing any other actions or browsing any further.”
In plain English, it means Google Analytics will not count single page view sessions as a bounce if an event is fired in Google Analytics.
If bounce rate understood and customized well, it’s a suitable metric to measure and tell:
- If your landing pages are designed well
- If you are attracting the right audience on the website
However, looking at the bounce rate alone is not enough. Either you need to look at other metrics or setup qualitative data too.
4. Average Session Duration
Google Analytics defines Average session duration as:
Total duration of all sessions (in seconds) / number of sessions.
Google Analytics calculates average session duration by adding the session of duration of all the sessions on your website in a specified date range, and then dividing it by the total number of sessions in that date range.
It’s perfect metric to understand how engaging your website is.
5. Users by Channel (plus acquisition, behaviour, and conversion data grouped by channels)
When you are active on more than two marketing channels (which is usually the case), you would want to see its web impact, wouldn’t you?
You can check this data by default in Google Analytics. Channel groupings allow you to see where your web visitors are coming from. These channels are available as default like paid, organic, social, direct, email, referral, and so on.
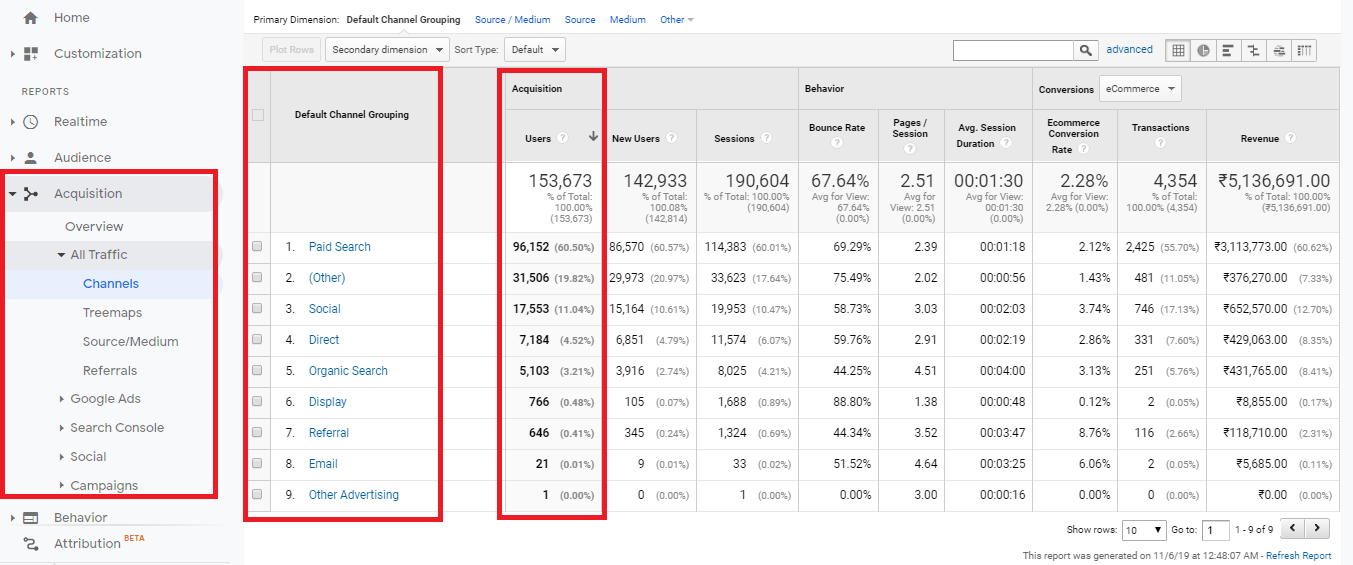
You can find users by channel in Google Analytics by navigating to Acquisition > All Traffic > Channels.
This will give you a bird’s eye view of your marketing efforts.
6. Pages Per Session
You don’t want your users to visit a blog and drop off even if they read it completely, do you?
Most modern websites have a strategy to make user browse the website well.
For instance, check the right column of this blog where you can see the popular posts. 👉
This helps our website maintain healthy average pages per session metric.
Keep track of this metric to check if your website has elements to make user click a CTA or explore another web page.
7. Goal Completions
This one is tricky. Tricky because you need to set up goals in Google Analytics to see if those goals are being hit.
Some of the usual goals you can setup on your website are:
- Purchases
- Form filled
- Product page visits
- Video played
In fact, this is the primary metric because goals are usually set up to reflect core business metrics. And naturally, it trumps all the metrics we discussed above.
You can check goals completed by navigating to Conversions > Goals > Overview.
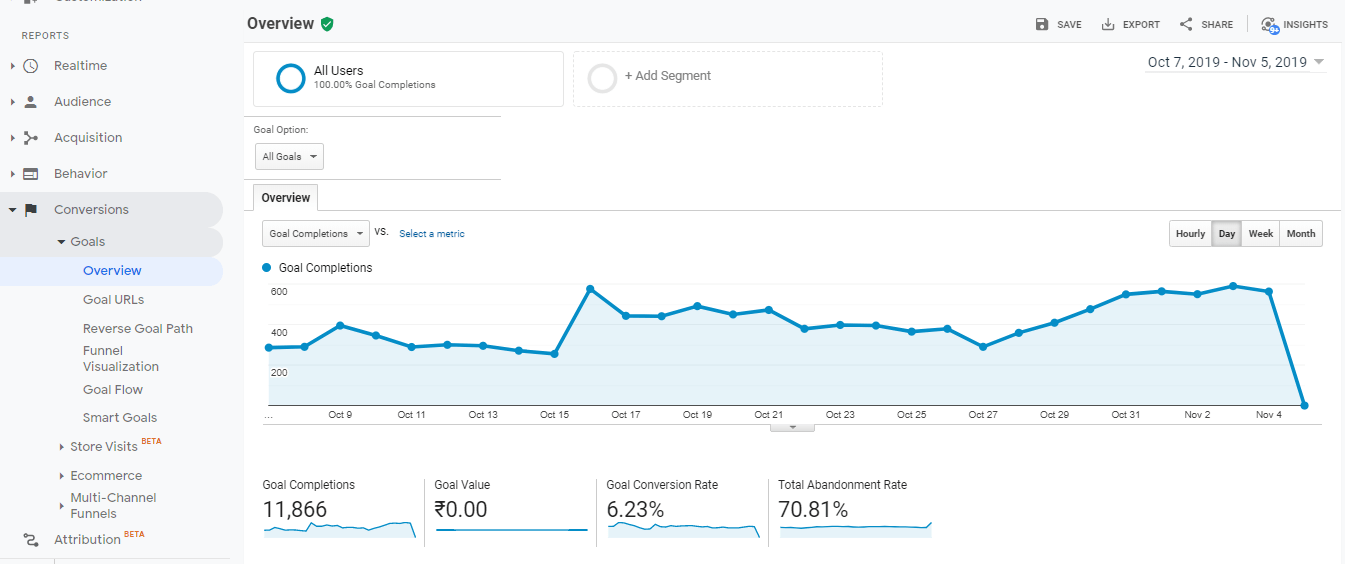
The best part about Google Analytics goals is: it can be different for all businesses. So you can set it up the way it makes sense for your business.
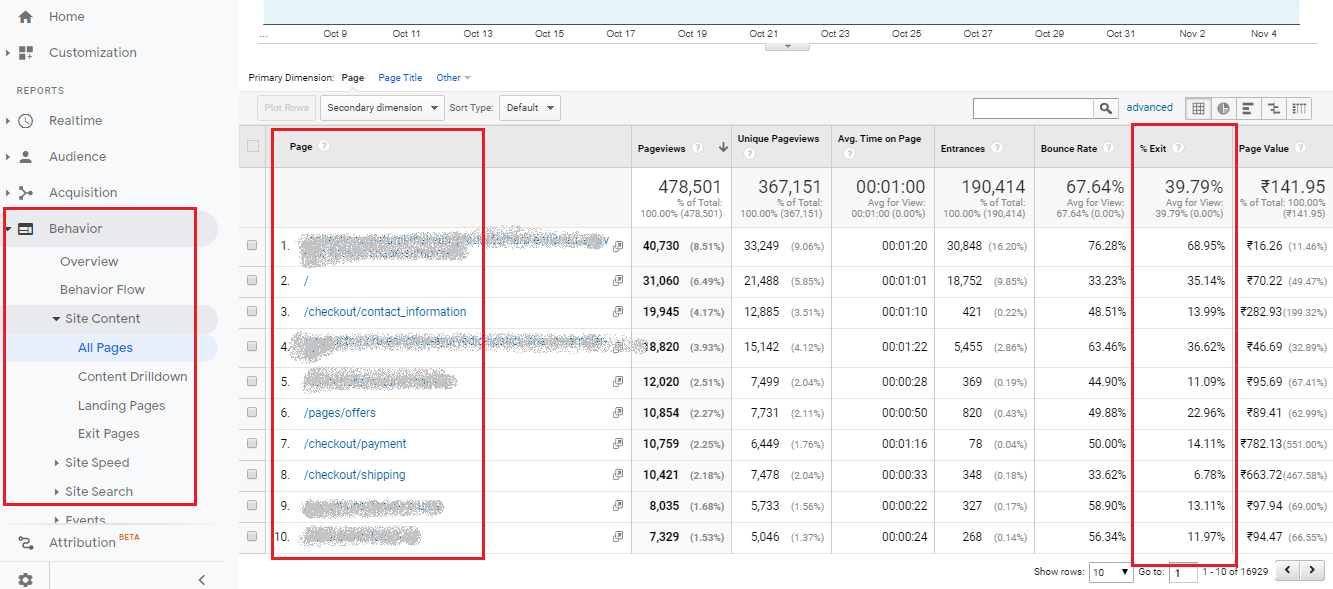
8. Exit Rate
While bounce rate told you the number of people who left your website without visiting any other page or taking an action, exit rate tells you how many people left a specific page or a set of pages.
Exit rate (written as %exit in Google Analytics) is calculated by dividing the number of ‘exits’ made from the page by the number of page views it has, to determine what proportion of visitors to that page leave it after visiting.
Navigate to Behavior >Â Site Content > All Pages to check exit rate of all the pages on your website.
You can also do this analysis for a group of pages or a specific page.
For instance, if you’re a SaaS business, you can check how many people are dropping off on your pricing page.
If exit rate is high, maybe you need to tweak the landing page to either shift user to another page or make him take an action.
Conclusion
This is just a teaser of what you can actually track and see in Google Analytics. There’s so much more you can do, especially with Google Analytics 360.
You can either hire marketing analytics consultants or Google Analytics experts to get the most out of your web data. You can not only improve your web conversions but also take informed decisions using Google Analytics data.
If you feel there’s any other metric you would want to track, please feel free to write to us and share your queries.